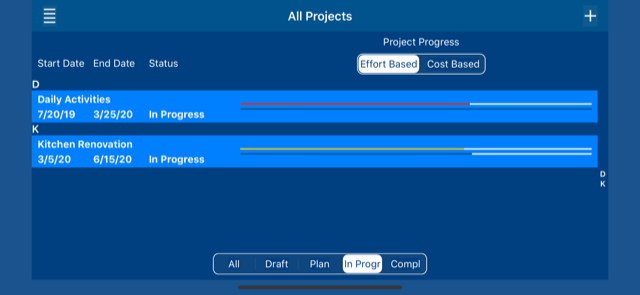
The All Projects screen lists all projects ordered by project name.
This screen allows you to filter projects by status and take the following actions:
Create projects.
Delete projects.
View project planning & tracking screen.
View project Gantt chart screen.
View project tasks screen.
View project to dos screen.
The All Projects screen shows the project effort or cost based progress bars when you rotate this screen from portrait to landscape orientation, and select the desired project progress option.
The top progress bar shows the actual progress. (*)
The bottom progress bar shows the expected progress.
(*) The actual progress bar is presented in different colors, in order to highlight the risk of not completing the project on time.
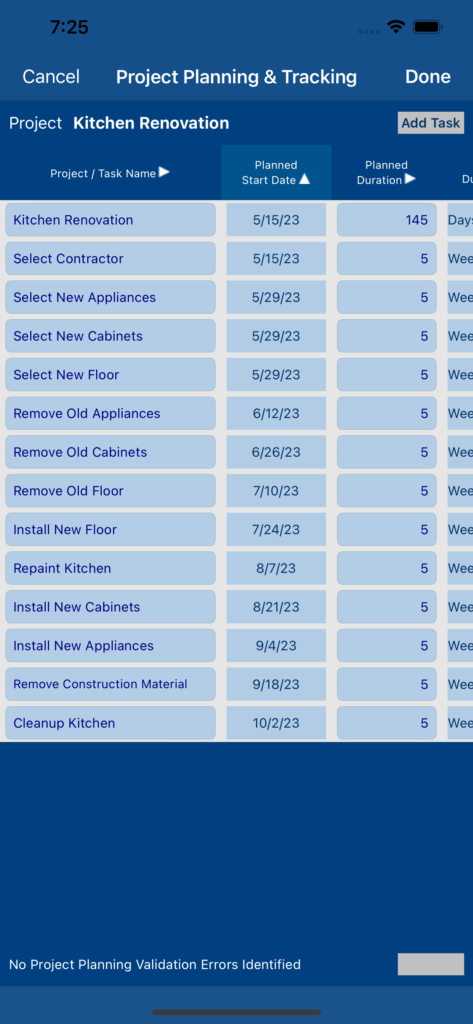
The Project Planning & Tracking screen implements a comprehensive Project & Task Planning & Tracking grid that allows you to provide:
Date Based Planning & Tracking Data: Tasks Without Predecessors: Planned Start & Finish Dates, Planned Duration & Duration Unit, and Actual Start & Finish Dates. Tasks With Predecessors: Planned Duration & Duration Unit, Predecessors’ Dependency Details, Actual Start & Finish Dates.
Effort Based Planning & Tracking Data: Planned Effort, Actual Entered & Timed Efforts, and Effort to Complete.
Cost Based Planning & Tracking Data: Planned Cost, Actual Cost, and Cost to Complete.
The following Project & Task Progress Indicators are automatically calculated based on the planning & tracking data provided:
Effort Based Actual Progress, Projected Progress, Progress Gap, and Progress Gap %
Cost Based Actual Progress, Projected Progress, Progress Gap, and Progress Gap %
Notes:
The Planned Finish Date is automatically calculated when you provide Planned Start Date & Planned Duration.
The Planned Duration is automatically calculated the you provide Planned Start & Finish Dates.
The Project & Task Planned Duration can be provided in Days, Weekdays, Weeks, or Months.
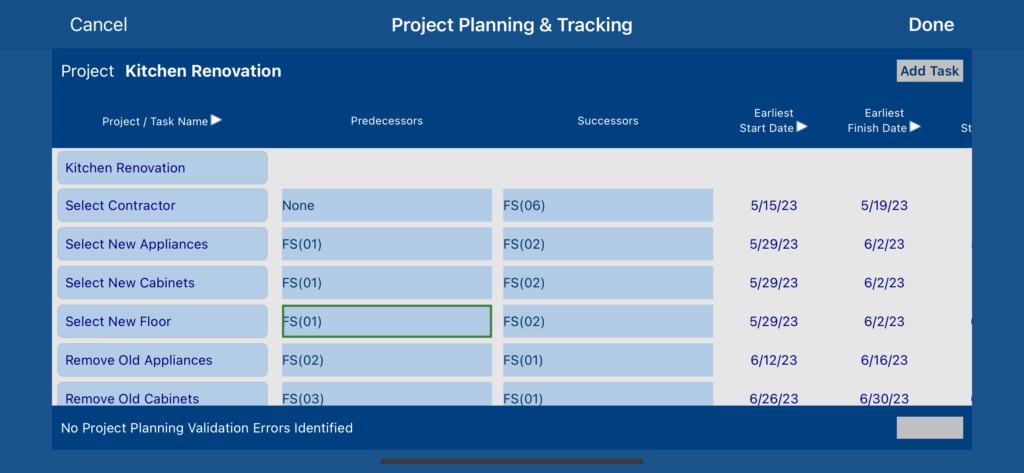
The Project Planning & Tracking screen uses the Task Planning & Dependency Data provided to automatically run the CPM (Critical Path Method) Planning Process as described below:
All Tasks Without Predecessors will have their Earliest Start & Finish Dates set to their respective Planned Start & Finish Dates.
All Tasks With Predecessors will have their Earliest Start & Finish Dates calculated & updated (Critical Path Method Forward Pass).
All Tasks With Predecessors will have their Planned Start & Finish Dates set to their respective Earliest Start & Finish Dates.
All Tasks Without Successors will have their Latest Start & Finish Dates set to their respective Earliest Start & Finish Dates.
All Tasks With Successors will have their Latest Start & Finish Dates calculated & updated (Critical Path Method Backward Pass).
All Tasks will have their Total Float & Free Float values calculated & updated.
The Task Predecessors screen allows you to add, update, and delete Predecessors for the selected task.
The screen grid includes the following columns:
Task Name – These cells allow you to select the Predecessor.
Dependency Rule – These cells allow you to select the Dependency Rules from the following choices: FS (Finish to Finish), FS (Finish to Start), SF (Start to Finish), and SS (Start to Start)
Dependency Lag – These cells allow you to add either a Delay Time (i.e. Positive Lag) or an Overlay Time (i.e Negative Lag).
Dependency Lag Unit – These cells allow you to select the Dependency Lag Unit from the following choices: Unit, Weekday, Week, and Month.
Notes:
The Predecessors are validated to prevent circular dependencies between Predecessors & Successors.
This screen allows you to sort the Predecessors by touching upon the Predecessor Header cells that include the Sort Indicator.
Any Predecessor created using this screen will be immediately available on the associated Task Successors screen (and vice-versa)
The Task Successors screen allows you to add, update, and delete Successors for the selected task.
The screen grid includes the following columns:
Task Name – These cells allow you to select the Successor.
Dependency Rule – These cells allow you to select the Dependency Rule from the following choices: FS (Finish to Finish), FS (Finish to Start), SF (Start to Finish), and SS (Start to Start)
Dependency Lag – These cells allow you to add either a Delay Time (i.e. Positive Lag) or an Overlay Time (i.e Negative Lag).
Dependency Lag Unit – These cells allow you to select the Dependency Lag Unit from the following choices: Unit, Weekday, Week, and Month.
Notes:
The Successors are validated to prevent circular dependency between Predecessors & Successors.
This screen allows you to sort the Successors by touching upon the Successor Header cells that include the Sort Indicator.
Any Successor created using this screen will be immediately available on the associated Task Predecessors screen (and vice-versa).
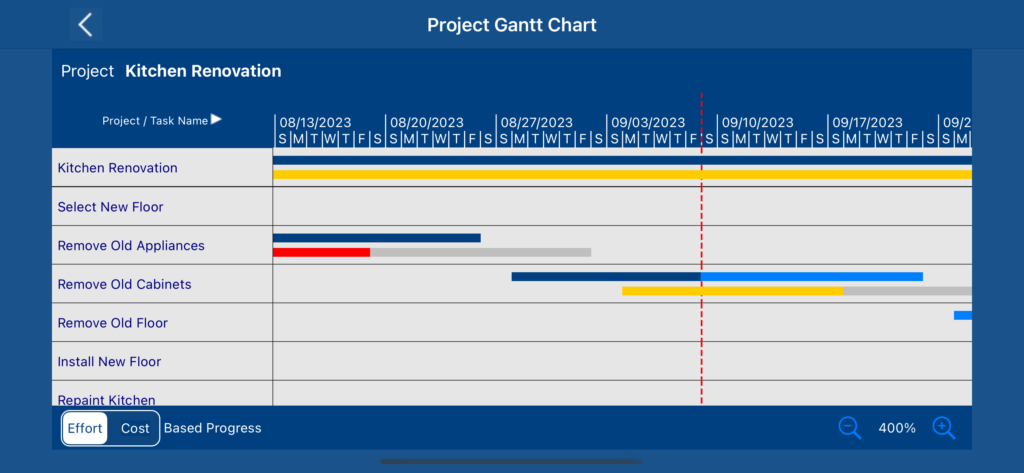
The Project Gantt Chart screen provides the Gantt chart for the selected project.
The screen grid includes the following project & task details:
Project & Task Names
Planned Start & Finish Dates
Actual Start & Finish Dates
Projected & Actual Progress
The chart section includes the following visual elements:
Project & Task Tracking Bars depicting Actual Start & Finish Dates, and Actual Progress
Notes:
The Estimated Finish Dates are depicted, instead of the Actual Finish Dates, for In-Progress Projects & Tasks.
The Actual Progress Bar Sections are presented in different colors, in order to highlight the Project & Task Delay Risks.
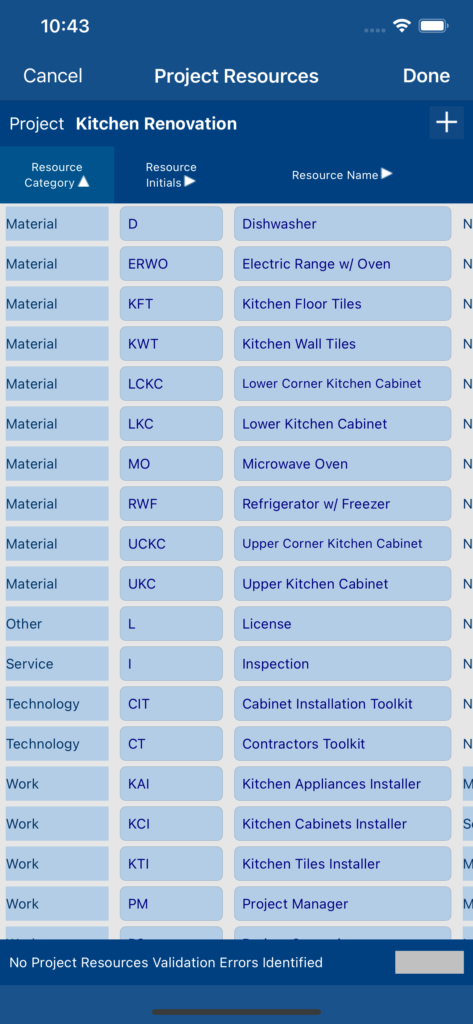
The Project Resources screen allows you to add, update, and delete resources for the selected project providing:
Resource Identification Data: Initials, Name, Seniority, and Group.
Resource Category: Work, Material, Technology, Services, and Other.
Week Days Available (A)
Daily Hours Available (A)
Available Quantity
Resource Unit
Resource Cost
Cost Basis: Hour, Day, Unit, and Task.
Cost Accrual: Start Date, Finish Date, and Prorated.
This screen provides the following resource allocation totals:
Allocated Quantity
Allocated Days (A)
Allocated Time (A)
Allocated Cost
Notes:
(A) For Work & Technology Resources only.
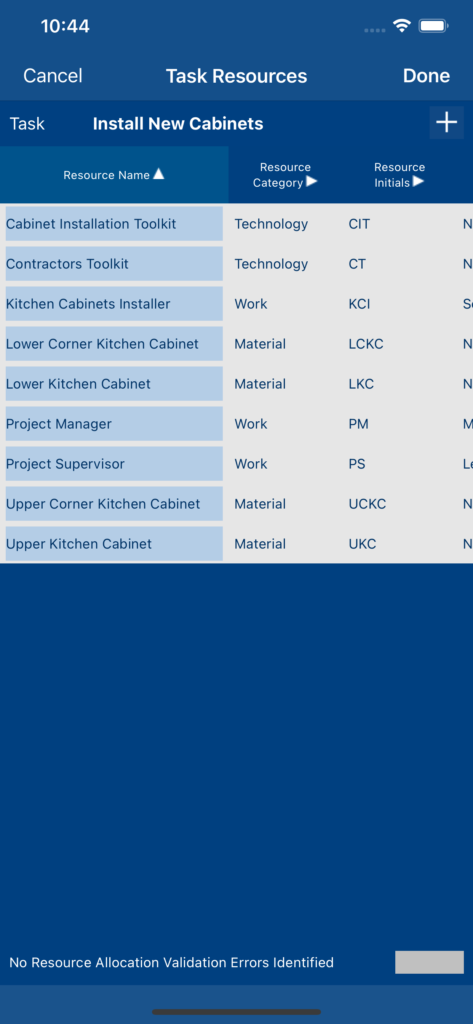
The Task Resources screen allows you to allocate one or more resources to the selected task providing:
Selected Resource
Allocated Quantity
This screen provides the following resource allocation totals:
Allocated Days (A)
Allocated Time (A)
Allocated Cost
Notes:
(A) For Work & Technology Resources only.
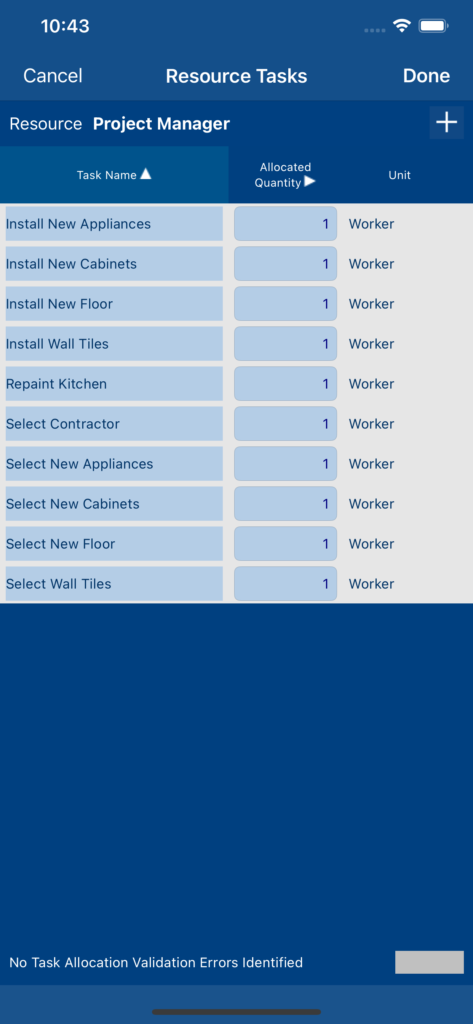
The Resource Tasks screen allows you to allocate the selected resource to one or more tasks providing:
Selected Task
Allocated Quantity
This screen provides the following resource allocation totals:
Allocated Days (A)
Allocated Time (A)
Allocated Cost
Notes:
(A) For Work & Technology Resources only.
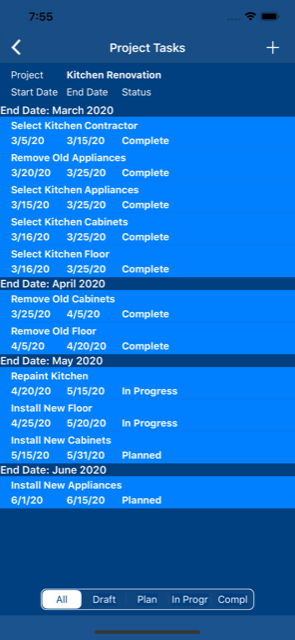
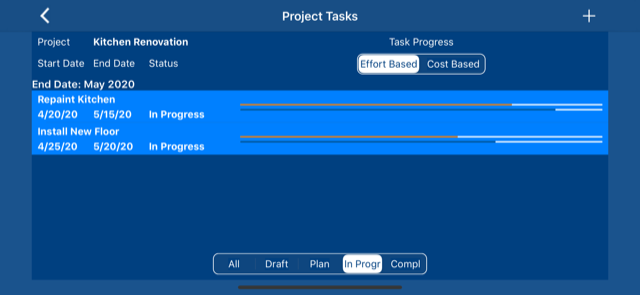
The Project Tasks screen lists all tasks associated to a particular project ordered by task end date.
This screen allows you to filter tasks by status and take the following actions:
Delete tasks.
View task timer screen.
View task to dos screen.
The Project Tasks screen presents the project tasks effort or cost based progress bars when you rotate the screen from portrait to landscape orientation, and select the desired task progress option.
The top progress bar shows the actual progress. (*)
The bottom progress bar shows the expected progress.
(*) The actual progress bar is presented in different colors, in order to highlight the risk of not completing the task on time.